
Bar chart race maker
Type a table of names and numbers over time. Download a bar chart race video.
Runs in your browser. Nothing is uploaded.
H.264 MP4, 30 fps, silent.
How to make a bar chart race
- 1Type the period labels on the first line, like years or months, separated by commas.
- 2Add one line per name: the name, then one number for each period. Or paste the rows from Google Sheets or Excel.
- 3Set the title, the rupee sign or unit, how many bars show, and the leader colour.
- 4Pick the clip length. The race is spread over it and holds the final ranking for the last moment. Download the MP4.
What editors use it for
Business and sales updates
Cities, products or stores ranked month by month, so the viewer sees who pulled ahead and when.
Education and general knowledge
Countries, states or companies over the years: population, GDP or market share as a race instead of a static table.
Creator and sports stats
Followers, runs or wins over seasons. The overtake is the moment the video is about.
Bar chart race video kaise banaye
Pehli line mein saal ya mahine likhiye, comma laga ke: 2021, 2022, 2023. Phir har naam ki ek line: naam, aur har saal ka number.
Bade amounts ko poora likhiye (1250000) aur "Show numbers in" mein lakh ya crore chuniye, chart mein ₹12.5 L jaisa dikhega.
Clip ki length chuniye aur MP4 download kijiye. Yeh poora frame hai, isse apni video mein cutaway ki tarah lagaiye.
Questions
How do I write the table?
The first line holds the period labels separated by commas. Every other line is a name followed by one number per period, also separated by commas. Rows pasted from Google Sheets or Excel (tab separated) work too, and there digit commas such as 12,50,000 are read correctly. If a name has fewer numbers than there are periods, its last number is held.
How many names and periods can a race have?
Up to 12 names and 12 periods. Between 3 and 12 bars are on screen at once; names ranked below that slide out and come back when they climb. Each period needs at least 0.4 seconds, so a long table needs a longer clip. Names wider than the label column (about 20 letters) end in "...", and Hindi names work as typed.
Can it show lakh and crore?
Yes. Type the full amounts and choose lakh or crore under "Show numbers in", then add ₹ before the number. Digits are grouped in thousands (1,250), so for big figures the lakh or crore unit reads better than the raw number.
Why only 16:9?
The race is laid out for a landscape frame, with names on the left and room for the bars to grow to the right. In a vertical frame the same chart would be small with empty space above and below, so the tool only exports 16:9.
Is there a watermark or a sign up?
No. The race is drawn and encoded in your browser, so there is no watermark and no account. Your table is not uploaded anywhere.
Tools that go with this
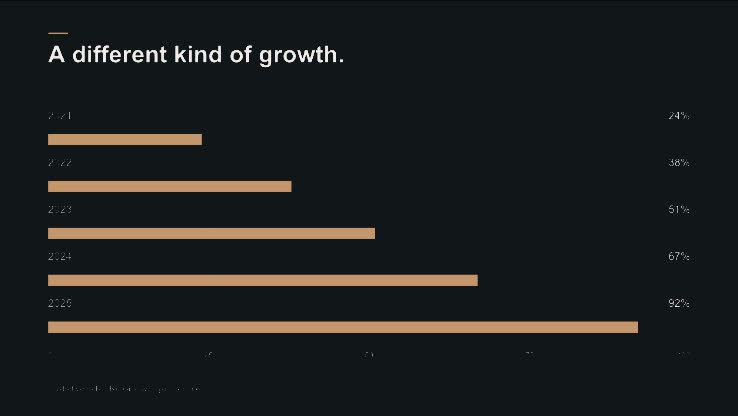
Turn a few rows of data into an animated bar or line chart.
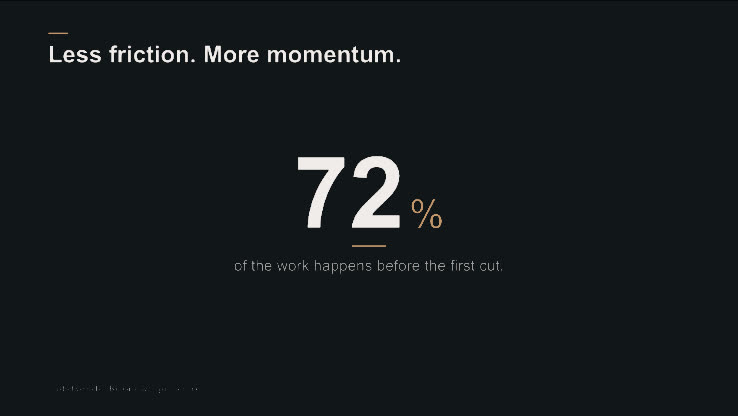
Animate a number into a clean, ready-to-edit stat card.
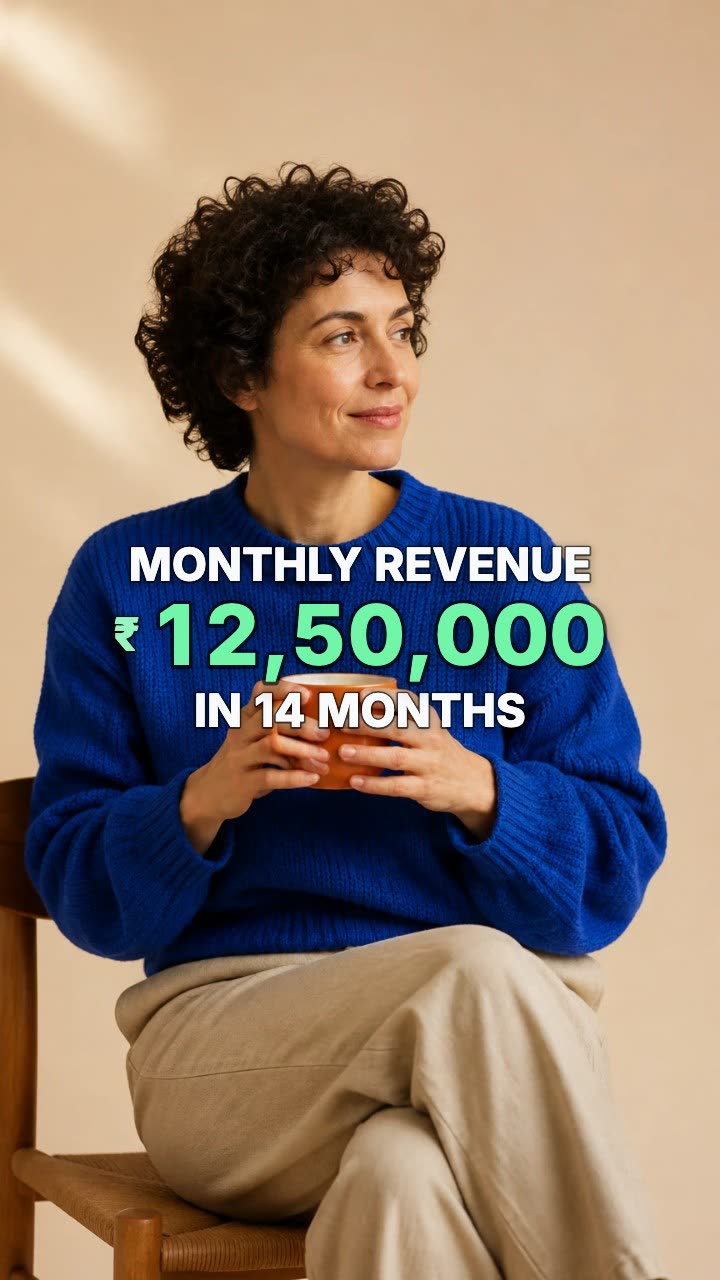
A number that counts up from zero and lands on your figure.

A number that rolls like a mechanical counter from one value to another.
More numbers and data tools: Comparison animation maker · Pictogram chart animation maker
In Headroom: AI Edits: motion graphics placed on your video for you