
Pictogram chart animation maker
Type a share out of 100 and what it is about. Download a grid of 100 figures that lights up to your number.
Runs in your browser. Nothing is uploaded.
The preview background is only for judging the graphic. Your download has no background unless you pick a green screen or black file.
H.264 on flat green, chosen so it does not clash with your colours.
Place the clip on a track above your video in CapCut. Select it, open Remove BG, then Chroma key. Pick the background colour and raise the strength until it is gone.
How to make a pictogram chart
- 1Type how many out of 100, and choose whether a % sign follows the number.
- 2Write the line that goes under the grid, such as "of our students got a job offer".
- 3Pick the colour, the side, the height and the size, then the length of the clip.
- 4Choose your editor and download. Desktop editors get a transparent MOV, phone editors get a green screen MP4.
What editors use it for
Survey and poll results
Show "62 out of 100 said yes" as people, so the share is felt rather than read as a bare number.
Course and coaching results
Placements, pass rates or clients who renewed: the figures light up to the share while you say it.
Health and social explainers
One in four, nine in ten: write it as 25 or 90 out of 100 and let the grid make the scale visible.
Which file for which editor
- CapCutGreen screen MP4
- VNGreen screen MP4
- InShotGreen screen MP4
- Premiere ProTransparent MOV
- After EffectsTransparent MOV
- DaVinci ResolveTransparent MOV
- Final Cut ProTransparent MOV
- CanvaMP4 video
- OBSTransparent WebM
Pick your editor in the tool and it shows the exact steps to place the file. Have a green screen clip already? Turn it into a transparent video.
Questions
Can I show 1 in 4 instead of 25%?
Write it as 25 and choose no % sign, then say "out of 100" in the line, for example "out of 100 people skip breakfast". The grid always has 100 figures, so the share has to be out of 100.
What is the dark glow behind the grid?
The chart sits on a soft dark shade so the figures read on bright footage. The transparent MOV keeps it as a real shadow. In the green screen MP4 it shows as darker green around the chart; if a dark ring stays after keying, raise the strength of your chroma key or use the MOV.
How small is the text?
In the original effect the line under the grid is small. The tool scales the whole chart up, 2.6 times by default, so on a 1080 wide video the line is set in about 31 pixel type. Keep the size high if the line matters, and keep the line short so the chart does not have to shrink to fit it.
Can the line be in Hindi?
Not in Devanagari. The line is spaced out letter by letter, which breaks Hindi script, so it takes Roman letters. Hinglish such as "logon ne haan kaha" works.
When do the figures light up?
The 100 figures pop in during the first half second, the share lights in a diagonal wave from about one second while the number counts up, and the chart fades out in the last 0.4 seconds of the clip.
Tools that go with this
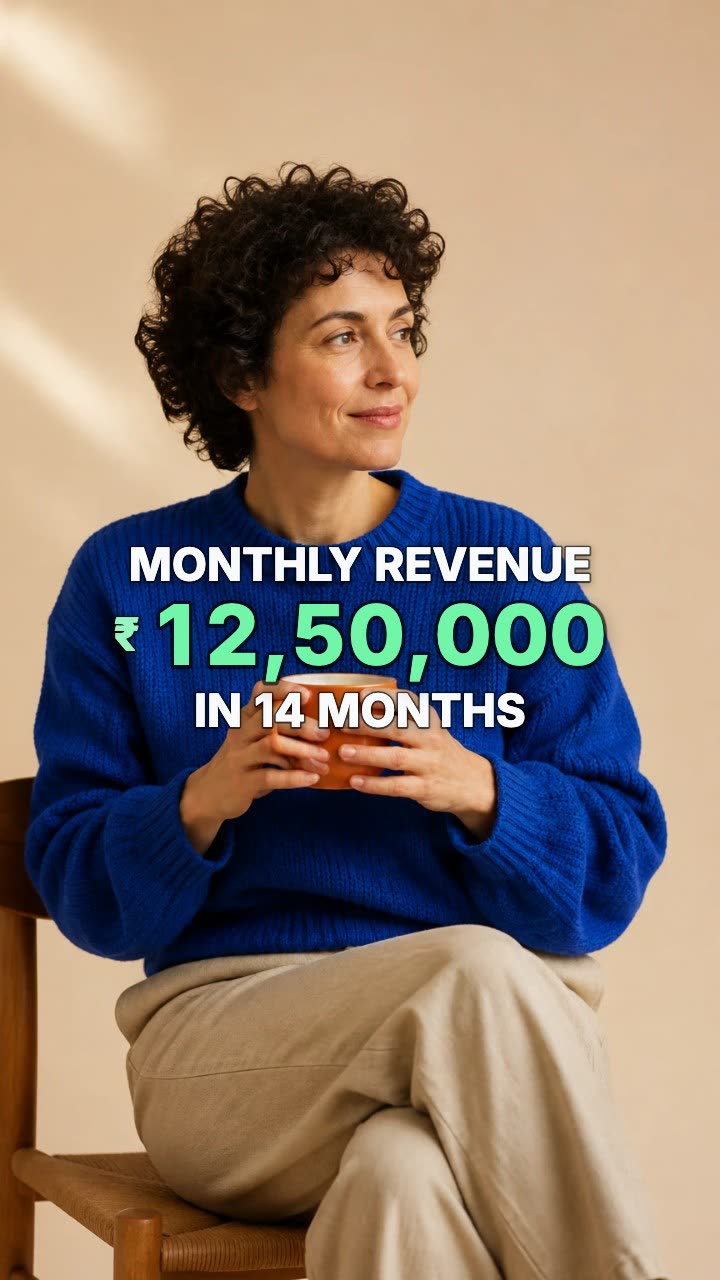
A number that counts up from zero and lands on your figure.
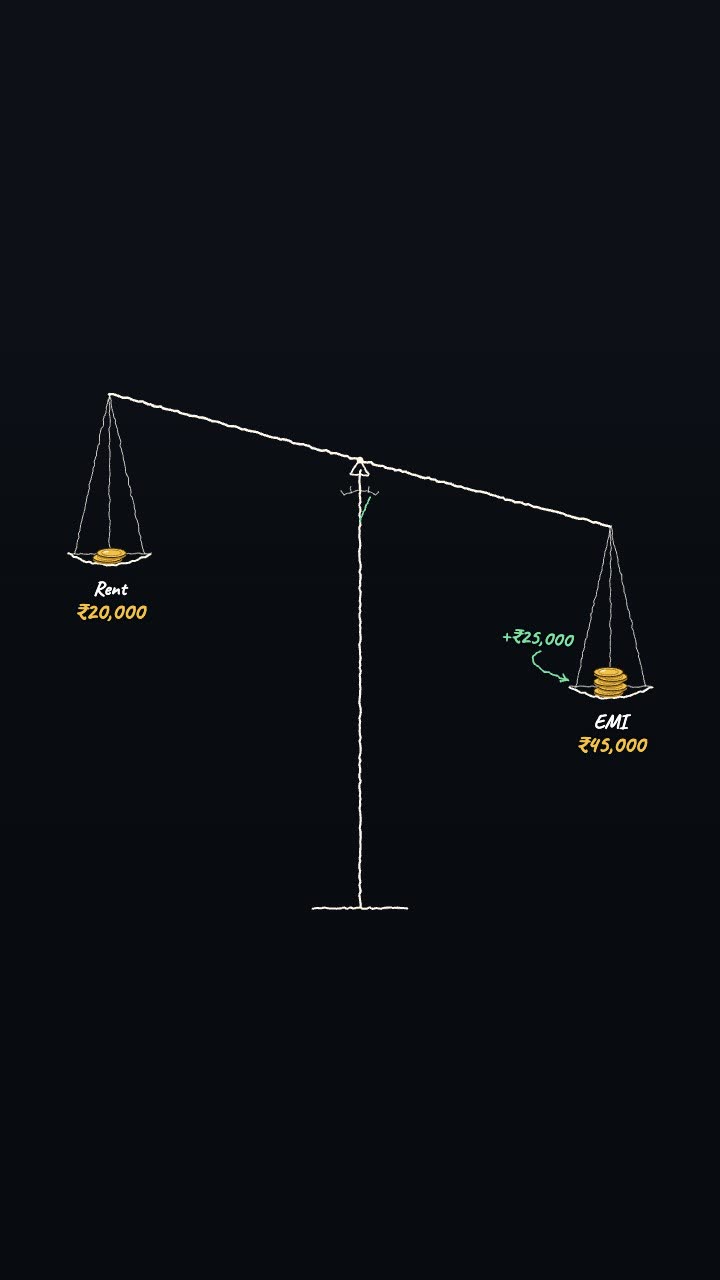
Two amounts weighed on a hand-drawn scale, the difference written by the heavier side.
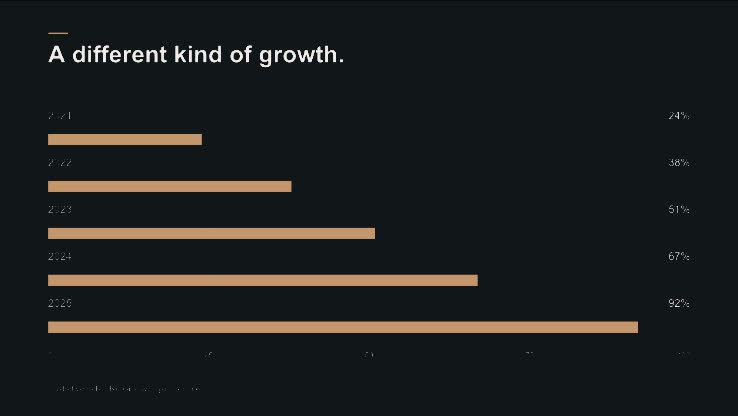
Turn a few rows of data into an animated bar or line chart.
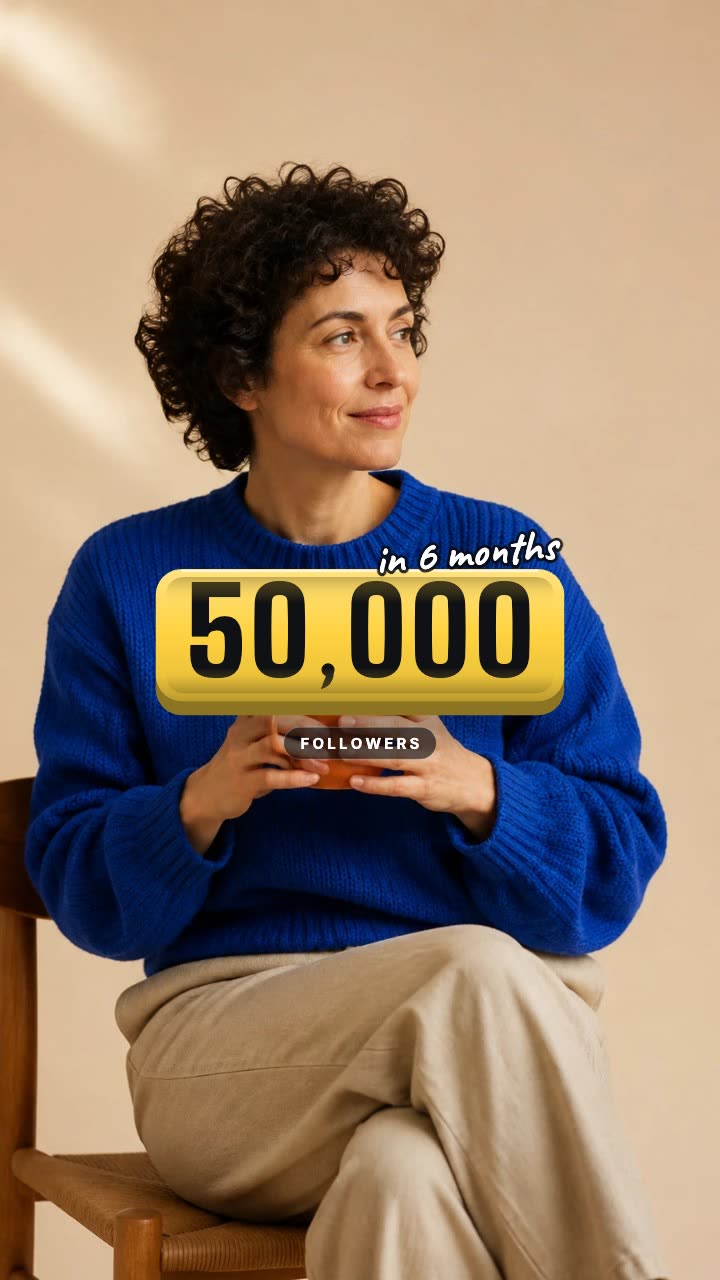
A number that rolls like a mechanical counter from one value to another.
More numbers and data tools: Bar chart race maker · Animated stat and counter video maker
In Headroom: AI Edits: motion graphics placed on your video for you