
India state-wise data map animation
Paste a value for each state. The map of India fills in value order, adds labels and a legend, then calls out the top states.
Runs in your browser. Nothing is uploaded.
H.264 MP4, 30 fps, silent.
State boundaries: DataMeet India community, CC BY 4.0, github.com/datameet/maps
How to make an india state data map
- 1Paste one line per state with its number, from a spreadsheet or a report.
- 2Write the title, the unit and the source, so viewers know what the colours mean.
- 3Choose the colour scale and how many of the highest or lowest states to call out.
- 4Download the MP4 and cut it into your video.
What editors use it for
Explainers and news
Show literacy, GDP per person, vote share or rainfall state by state, with the source on screen.
Exam and study channels
Turn a state-wise table from a report into a map students remember.
Election coverage
Colour states by seats or turnout and call out the three biggest.
State-wise data ka India map video kaise banaye
Har line mein state ka naam aur number likhiye, jaise "Kerala, 94". Hindi naam ya MH, UP jaise code bhi chalenge.
Title, unit (%, ₹, crore) aur source likhiye. Map number ke hisaab se colour hoga aur sabse upar ke states highlight honge.
MP4 download karke apni video mein lagaiye. Description mein source aur DataMeet ka credit zaroor daaliye.
Questions
What format should my data be in?
One state per line, then its number: "Kerala, 94", "UP: 67.7" or "उत्तर प्रदेश 67.7". Commas in Indian-style numbers like 1,23,456 are read correctly. A line the tool cannot read, or a name that is not a state or union territory, is refused with the closest state names.
How are the colours decided?
The lowest value gets the first colour of the scale and the highest gets the last, with the rest placed in between in proportion. The legend under the map shows the lowest and highest values. States with no number stay dark grey.
Is the default data real?
Yes. It is the number of Lok Sabha seats in each state and union territory, 543 in all, with Jammu and Kashmir at 5 and Ladakh at 1 since 2019. Replace it with your own numbers, such as literacy, GDP per person or vote share.
Does the map show India’s official boundary?
Yes, always: all of Jammu and Kashmir and Ladakh, including Pakistan-occupied Kashmir and Aksai Chin, and all of Arunachal Pradesh, with Ladakh and Jammu and Kashmir as separate union territories.
Can I show cities or districts?
Not yet. This map colours the 36 states and union territories. Smaller units such as Chandigarh, Puducherry or Lakshadweep are coloured but usually too small to label.
Tools that go with this
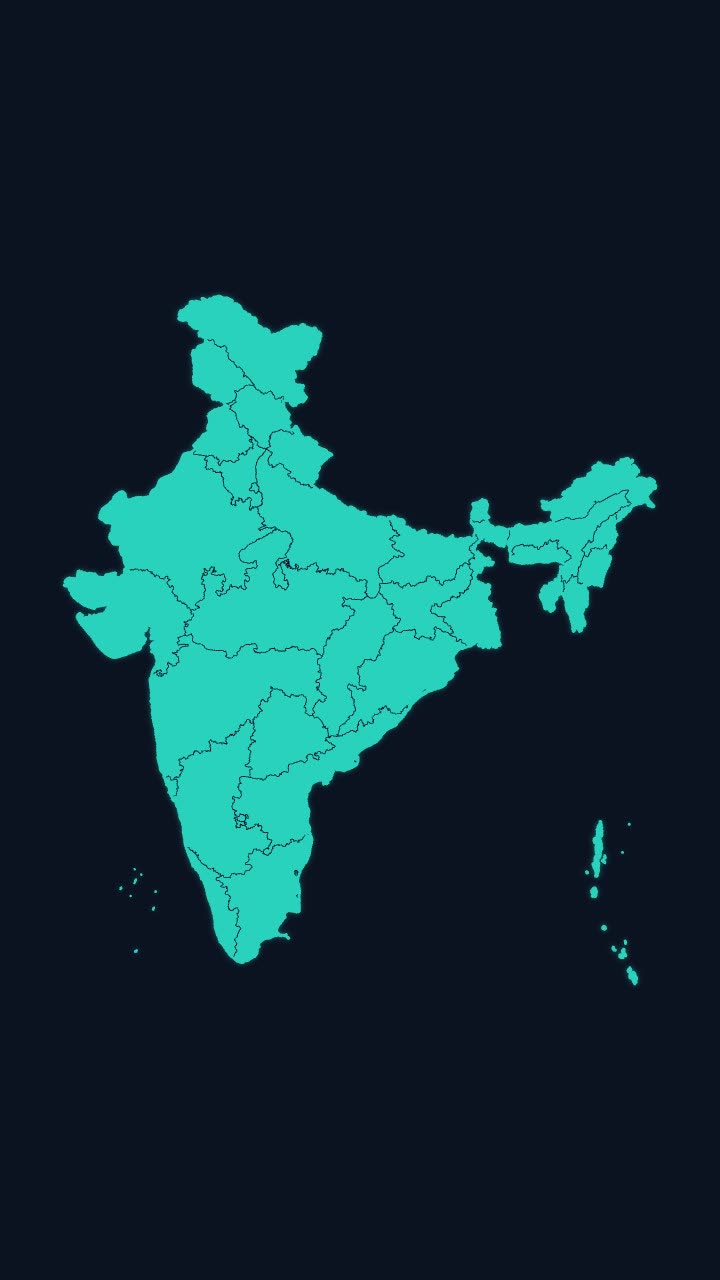
India’s outline draws itself, then every state appears, with names if you want them.
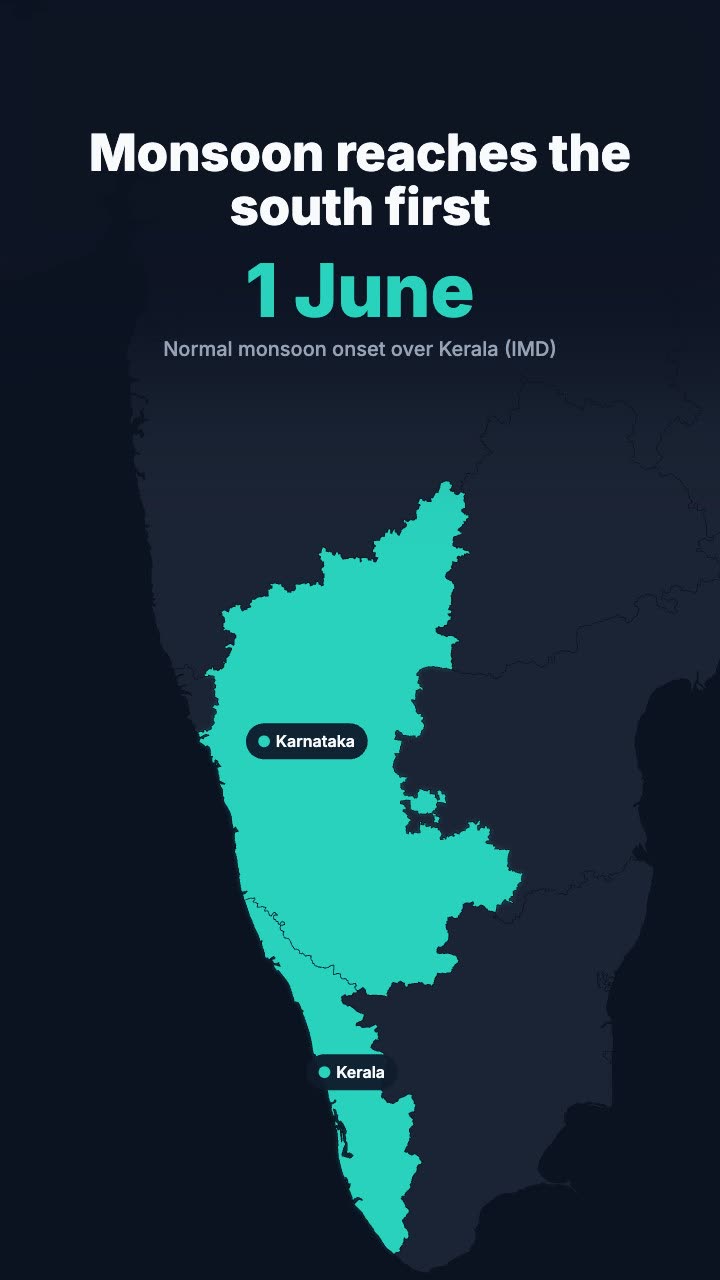
The map of India flies to the states you name, fills them in your colour and labels them.
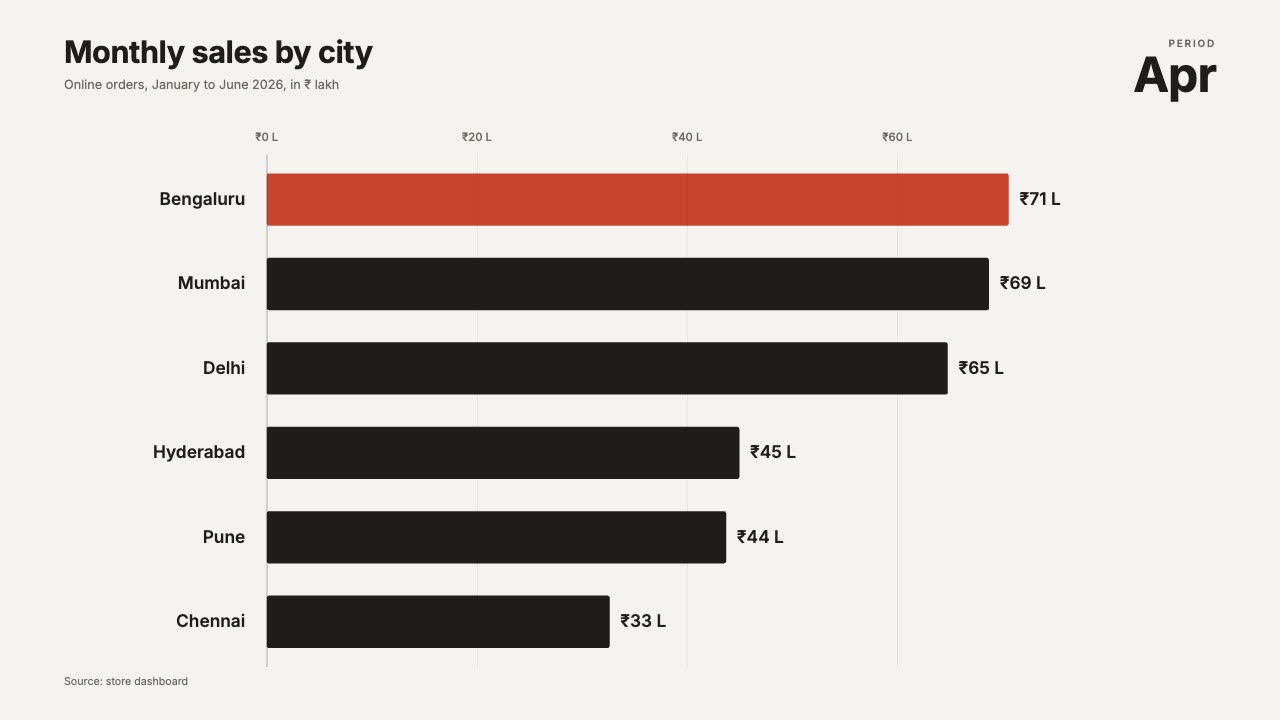
Ranked bars that overtake each other period by period, with a moving axis.
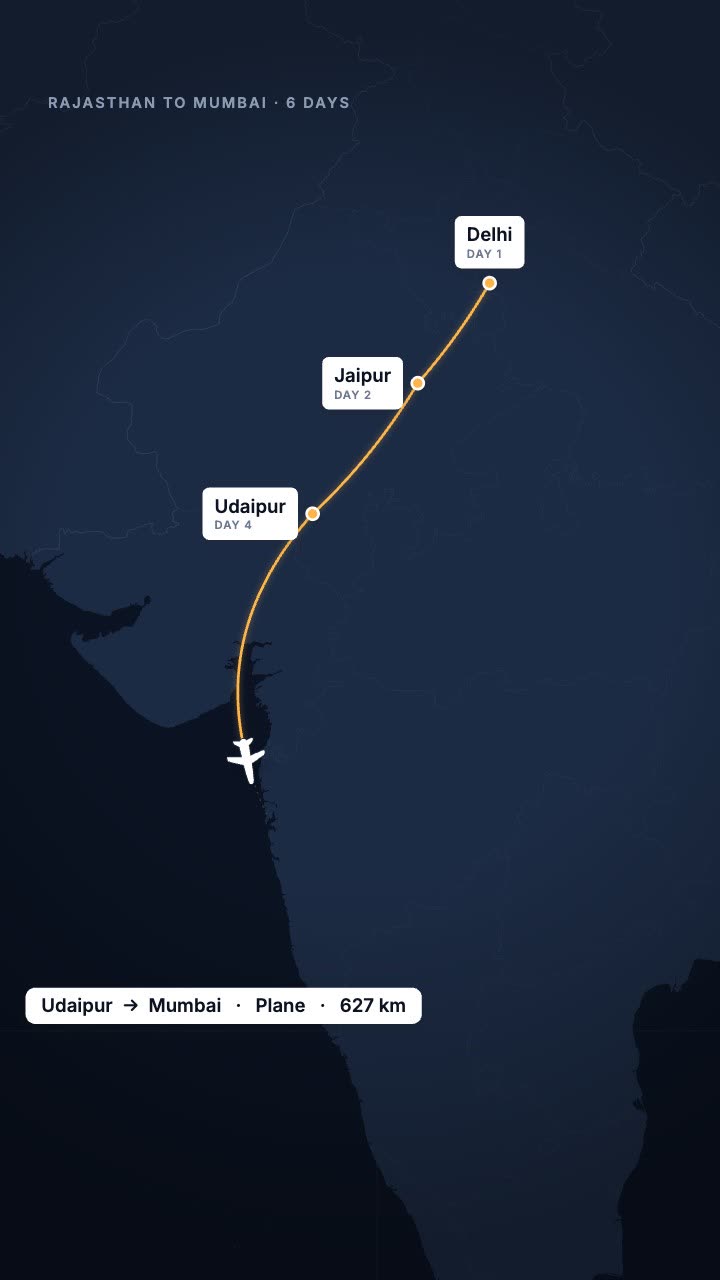
Your trip as a route map: the line draws city to city and a plane, train or car follows.
More maps tools: Earth zoom animation to any country · Map pin drop animation · Flight path animation on a globe · Country map animation maker
In Headroom: AI Edits: motion graphics placed on your video for you